Gloomy Economic Data
The recent decline in US stocks on January 3rd, driven by uncertainties surrounding potential interest rate cuts, has left investors seeking clarity. The minutes from the latest Federal Open Market Committee (FOMC) meeting failed to provide a clear timeline for rate adjustments, contributing to a 0.8% drop in the S&P 500 and a 0.76% decrease in the Dow.
Notably, the Nasdaq 100 experienced a significant 1.2% slide, marking its worst performance since October.
Tech Stocks Facing Challenges
The decline was particularly pronounced in the tech sector, which saw a four-day losing streak – the longest in over two months. Leading tech companies, including Tesla (dropping by 4%), Broadcom (sliding by 2.5%), and Nvidia (losing 1.2%), contributed to the downward trend.
Energy Shares Shine
In contrast, energy shares performed well, closely tracking the rise in oil prices. Chevron recorded a gain of 1.9%, while Exxon Mobil increased by 0.8%.
Impact of FOMC Uncertainties
Federal Reserve officials, acknowledging a high level of uncertainty in the economic outlook, have not provided clear signals on future rate cuts. This uncertainty leaves room for potential further rate increases, adding to the complexities of market dynamics.
The ISM Manufacturing PMI and Its Significance
Amidst these economic uncertainties, the Institute for Supply Management (ISM) Manufacturing Purchasing Managers’ Index (PMI) for the United States has garnered attention.
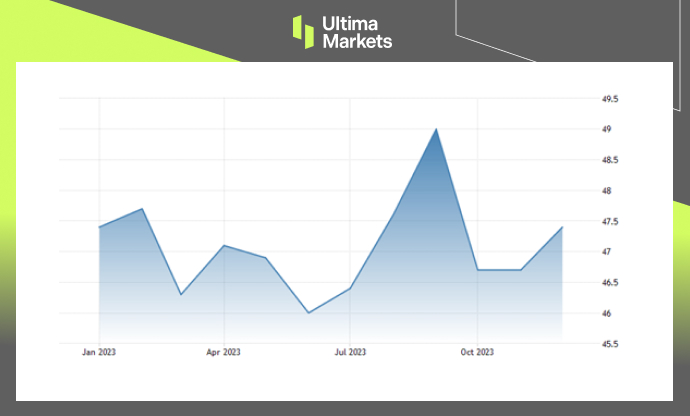
In December 2023, the PMI increased slightly to 47.4 from November’s 46.7, surpassing market forecasts of 47.1.

(Manufacturing PMI,ISM)
However, the PMI remains below the critical 50 threshold, indicating contraction in the manufacturing sector for the 14th consecutive month. This prolonged decline marks the longest period of contraction in factory activity since 2000-2001.

(25-Year Record of ISM Manufacturing PMI)
Exploring Key Economic Indicators
To gain a deeper understanding of the economic landscape, let’s explore key terms and concepts associated with the ISM Manufacturing PMI:
1) Manufacturing PMI
The Manufacturing PMI is a crucial economic indicator that reflects the health of the manufacturing sector. The December 2023 reading of 47.4 suggests ongoing challenges but also indicates a slight improvement.
2) ISM Report On Business
The ISM Report On Business provides comprehensive insights into the Manufacturing PMI, offering guidance based on reliable economic indicators.
3) Purchasing Managers Index (PMI)
Also known as the PMI, the Purchasing Managers Index is a monthly survey-based indicator, providing a snapshot of economic activity in the manufacturing sector. Investors closely watch this index for trends and potential economic shifts.
4) Composite Index
The PMI is a composite index, taking into account various factors such as New Orders and Production. Understanding the components of this index provides a holistic view of the manufacturing landscape.
5) New Orders and Production
Two key components of the PMI are New Orders and Production, each carrying a significant weight in the composite index. Monitoring these factors helps anticipate changes in economic activity.
December 2023 and Employment Index
The December 2023 Manufacturing ISM ® Report On Business highlights a 0.7 percentage point increase in the Manufacturing PMI to 47.4. Additionally, the Employment Index rose to 48.1%, showing improvement over the previous month.
Tracking US ISM Manufacturing PMI
For real-time data on the US ISM Manufacturing PMI, investors can refer to the current level of 47.40, reflecting a 1.50% change from the previous month. This data provides valuable insights into the ongoing dynamics of the manufacturing sector.
Economic Insights from Various Sources
To gain a comprehensive understanding, economists and investors often refer to multiple sources, including:
- Investopedia: Offering in-depth insights into the ISM Manufacturing Index and its calculation methods.
- Trading Economics: Providing a detailed overview of the United States ISM Purchasing Managers Index and its impact on business confidence.
- Investing.com: Offering a composite index based on seasonally adjusted diffusion indices for key indicators, including New Orders and Production.
- YCharts: Tracking the US ISM Manufacturing PMI with historical data and percentage changes.
- PR Newswire: Providing news updates on Manufacturing PMI and related economic indicators.
- FXstreet: Analyzing the Institute for Supply Management (ISM) Manufacturing Purchasing Managers Index as a leading indicator of business conditions.
Frequently Asked Questions
Q1: What does the ISM Manufacturing PMI signify?
The ISM Manufacturing PMI is a key economic indicator reflecting the health of the manufacturing sector. A reading below 50 indicates contraction, while a reading above 50 suggests expansion.
Q2: How is the Composite Index calculated?
The Composite Index, including New Orders and Production, is calculated based on seasonally adjusted diffusion indices. Each component carries varying weights, providing a comprehensive view of economic activity.
Q3: Why is the December 2023 Manufacturing ISM ® Report On Business significant?
The December 2023 report highlights a slight improvement in the Manufacturing PMI to 47.4, offering insights into the economic recovery. The Employment Index also rose, indicating positive trends in the job market.
Navigating Economic Uncertainties
As economists and investors navigate uncertainties in the economic landscape, insights from the ISM Manufacturing PMI and related indicators play a crucial role. By monitoring key factors such as New Orders, Production, and Employment, stakeholders can make informed decisions in the ever-changing market dynamics.
لماذا تختار تداول المعادن والسلع مع Ultima Markets؟
توفر Ultima Markets البيئة التنافسية الأفضل من حيث التكلفة والتبادل للسلع السائدة في جميع أنحاء العالم.
ابدأ التداولمراقبة فعالة للسوق أثناء تنقلك
الأسواق عرضة للتغيرات في العرض والطلب
جذابة للمستثمرين المهتمين فقط بالمضاربة على الأسعار
سيولة عميقة ومتنوعة بدون رسوم مخفية
لا يوجد مكتب تداول ولا إعادة تسعير
تنفيذ سريع عبر خادم Equinix NY4


